Pedestrian Safety Month 2025
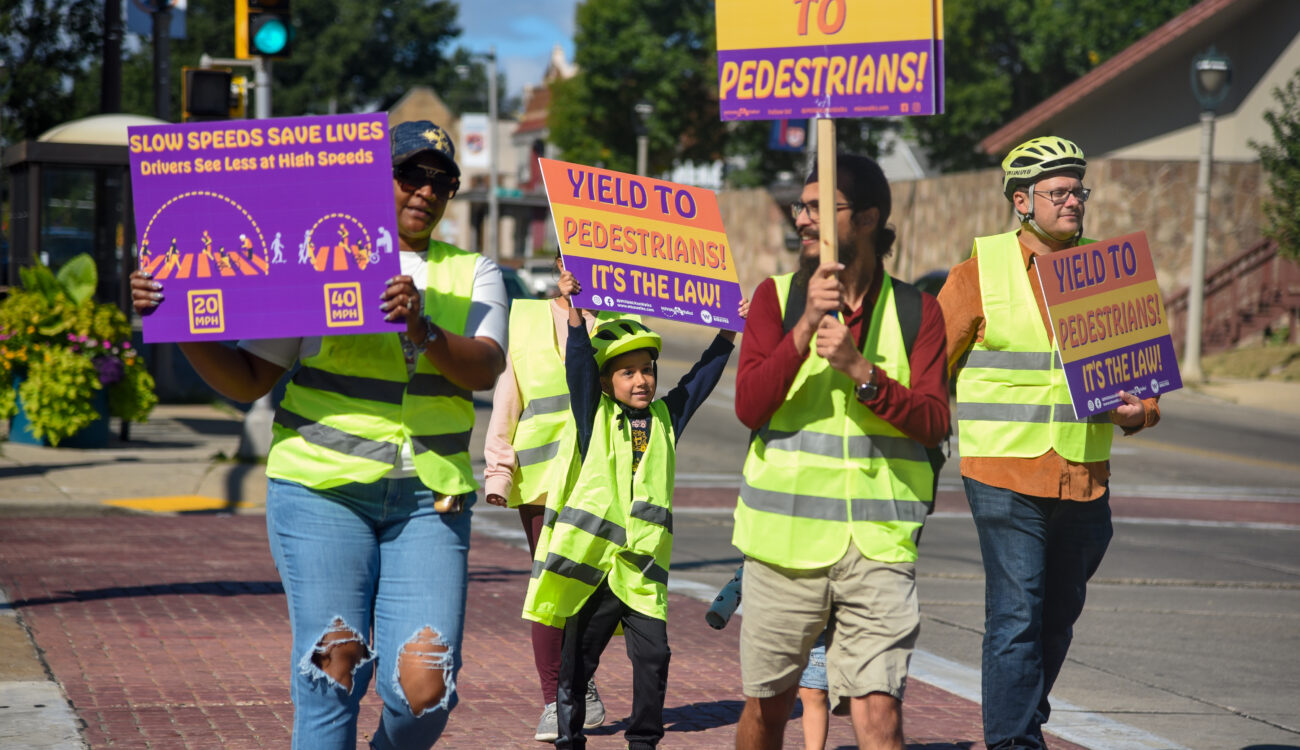
October is Pedestrian Safety month, and here at MilWALKee Walks we’re starting off the month with a look into the state of pedestrian safety in Milwaukee County.
October is Pedestrian Safety month, and here at MilWALKee Walks we’re starting off the month with a look into the state of pedestrian safety in Milwaukee County. In this series of blog posts, we hope to investigate some recent trends in pedestrian safety in Milwaukee and what is being done to improve the situation. This is going to be a data-heavy blog post, so get ready for some graphs and maps!
Mmm, I love graphs and maps…
How have pedestrian and bicyclist-involved car crashes changed in the last few years?
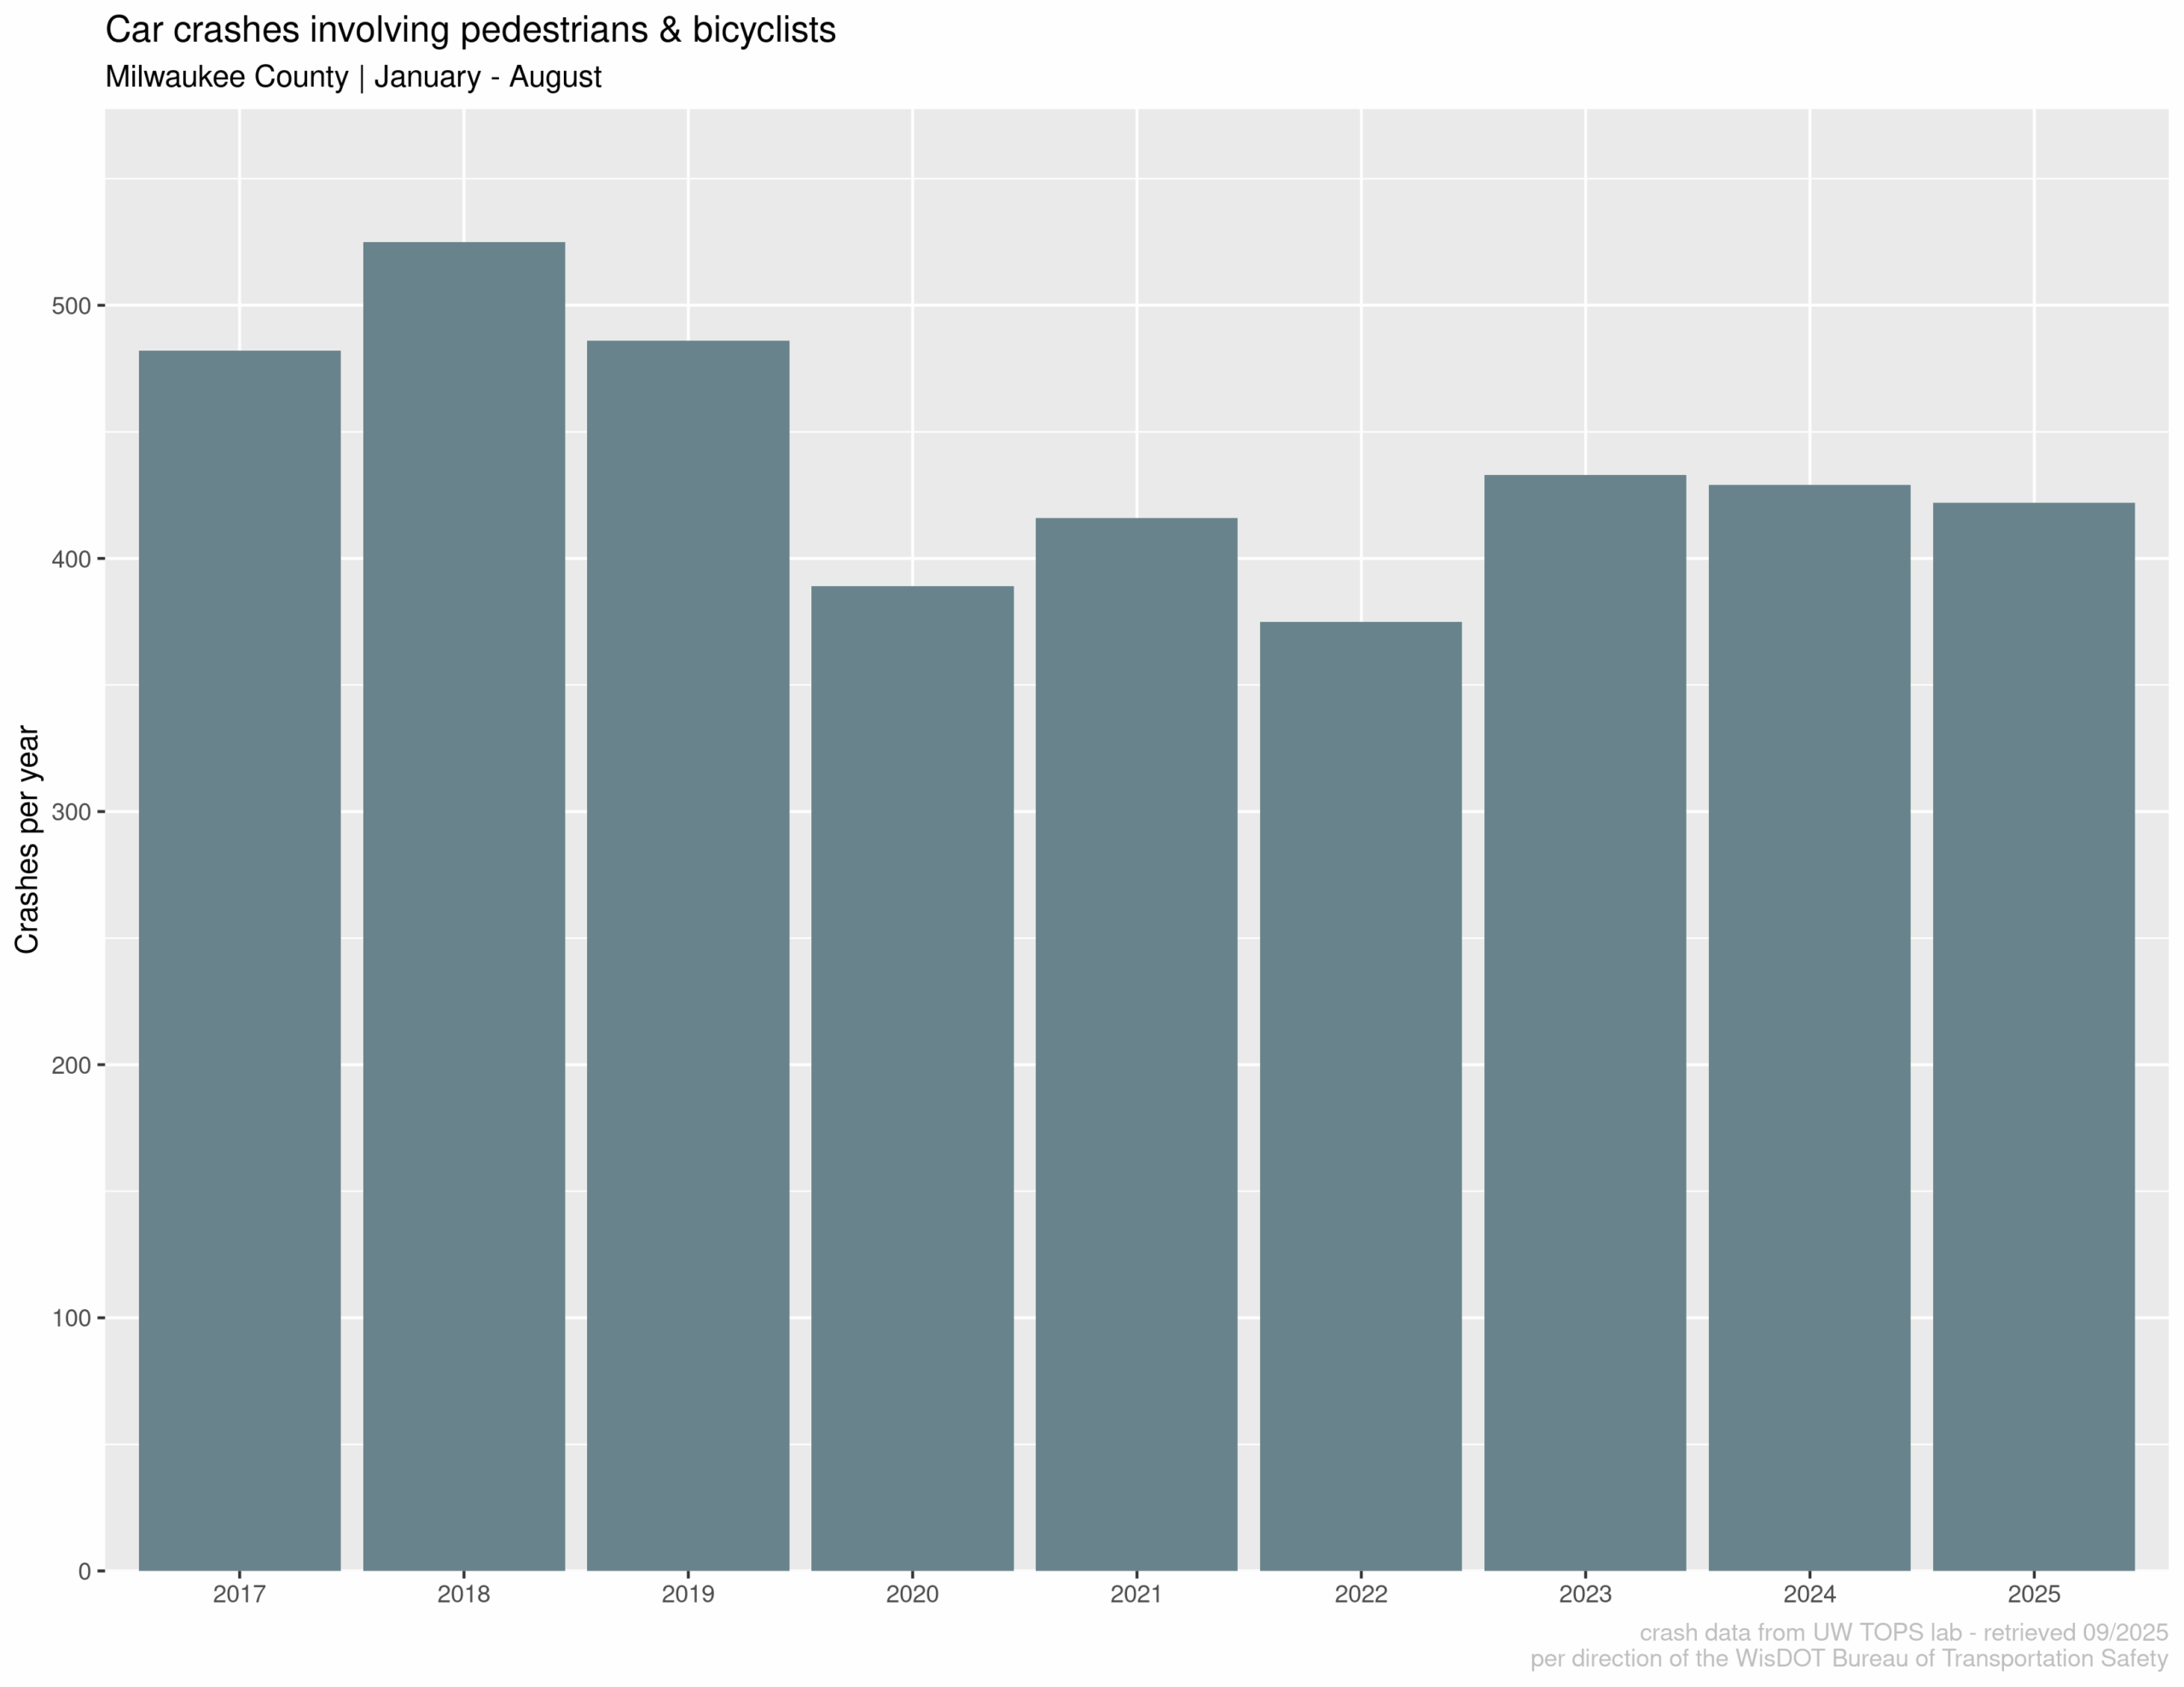
Looking at crashes from January through August for the last several years, 2025 is looking to be slightly lower than the last two years and is also continuing the trend of fewer crashes than pre-COVID, that’s an OK direction to be going. We wish there were far fewer pedestrian & bicyclist involved crashes, but change takes time.
Let’s just look at pedestrian/bicyclist-involved crashes where they were killed or severely injured:
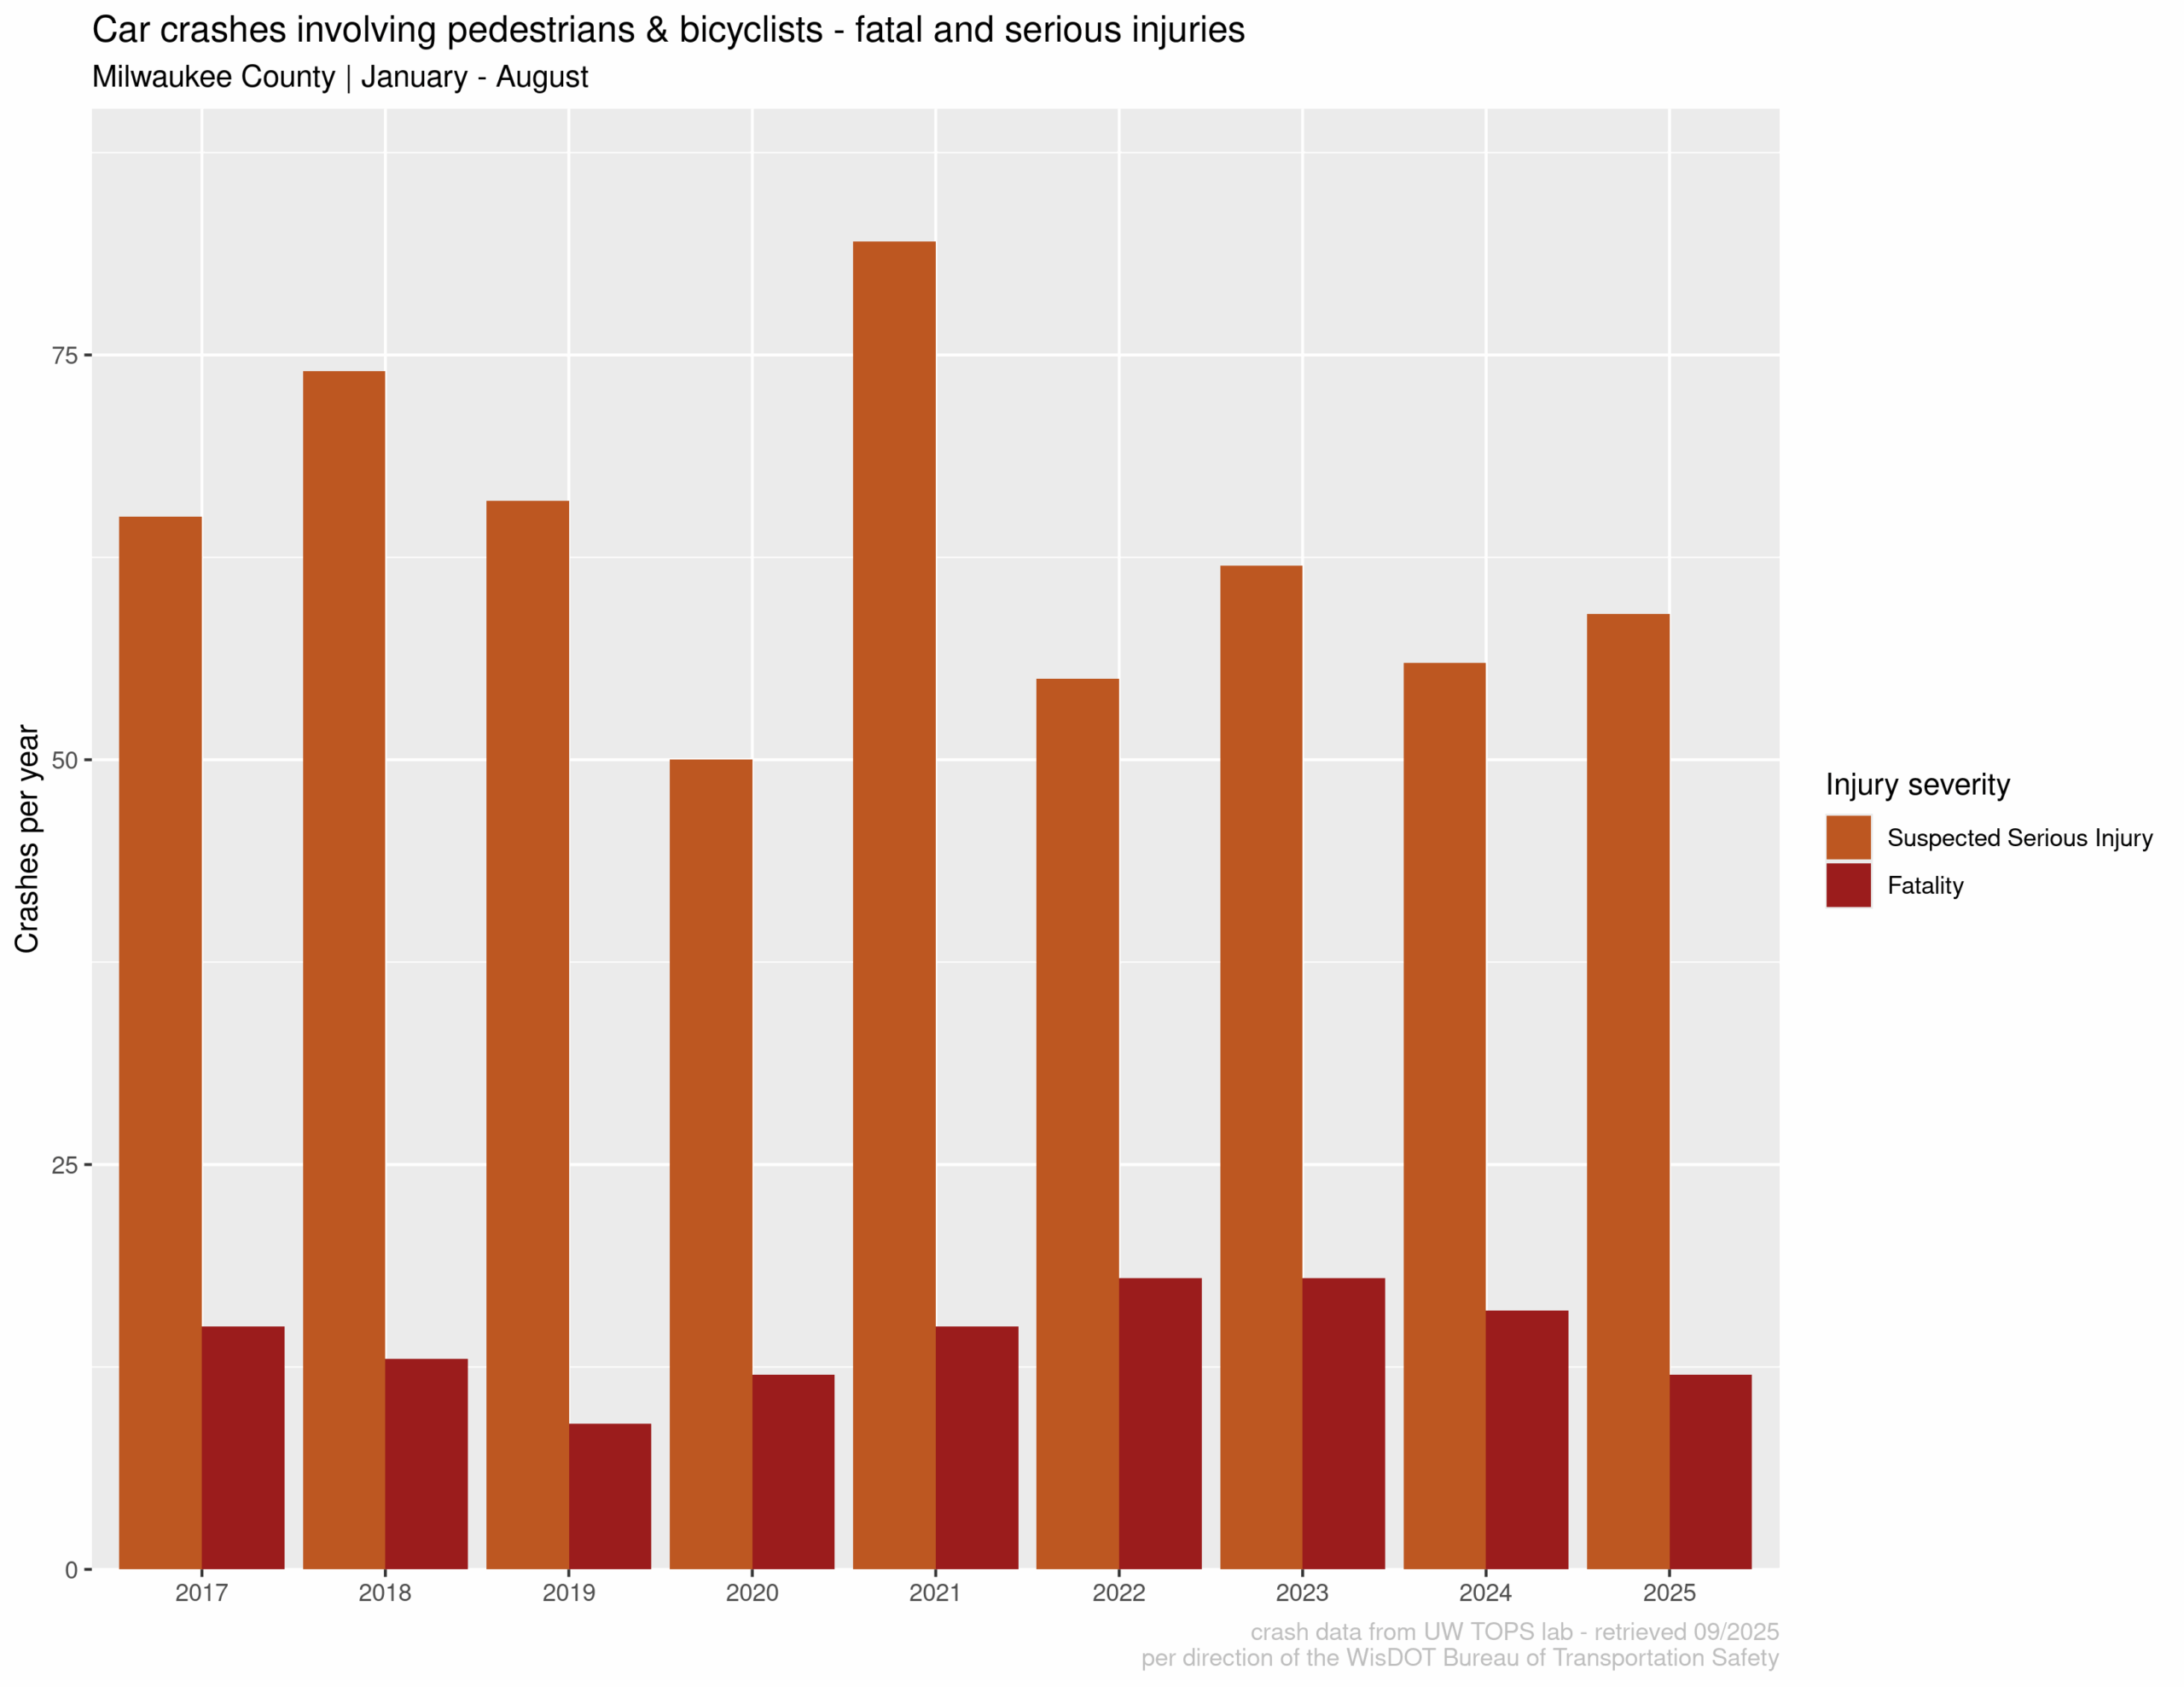
This shows 2025 has had the fewest fatalities in the last 5 years, and similar to levels during COVID. The recent trend is clearly fewer fatal crashes! That being said, the number of severe injuries is not going down. Severe injuries are ones that leave people in a coma or paralyzed.
Looking at cumulative crashes over the year shows that 2025 is on track to have fewer severe and fatal crashes than any year since 2017 (except for 2020 – COVID).
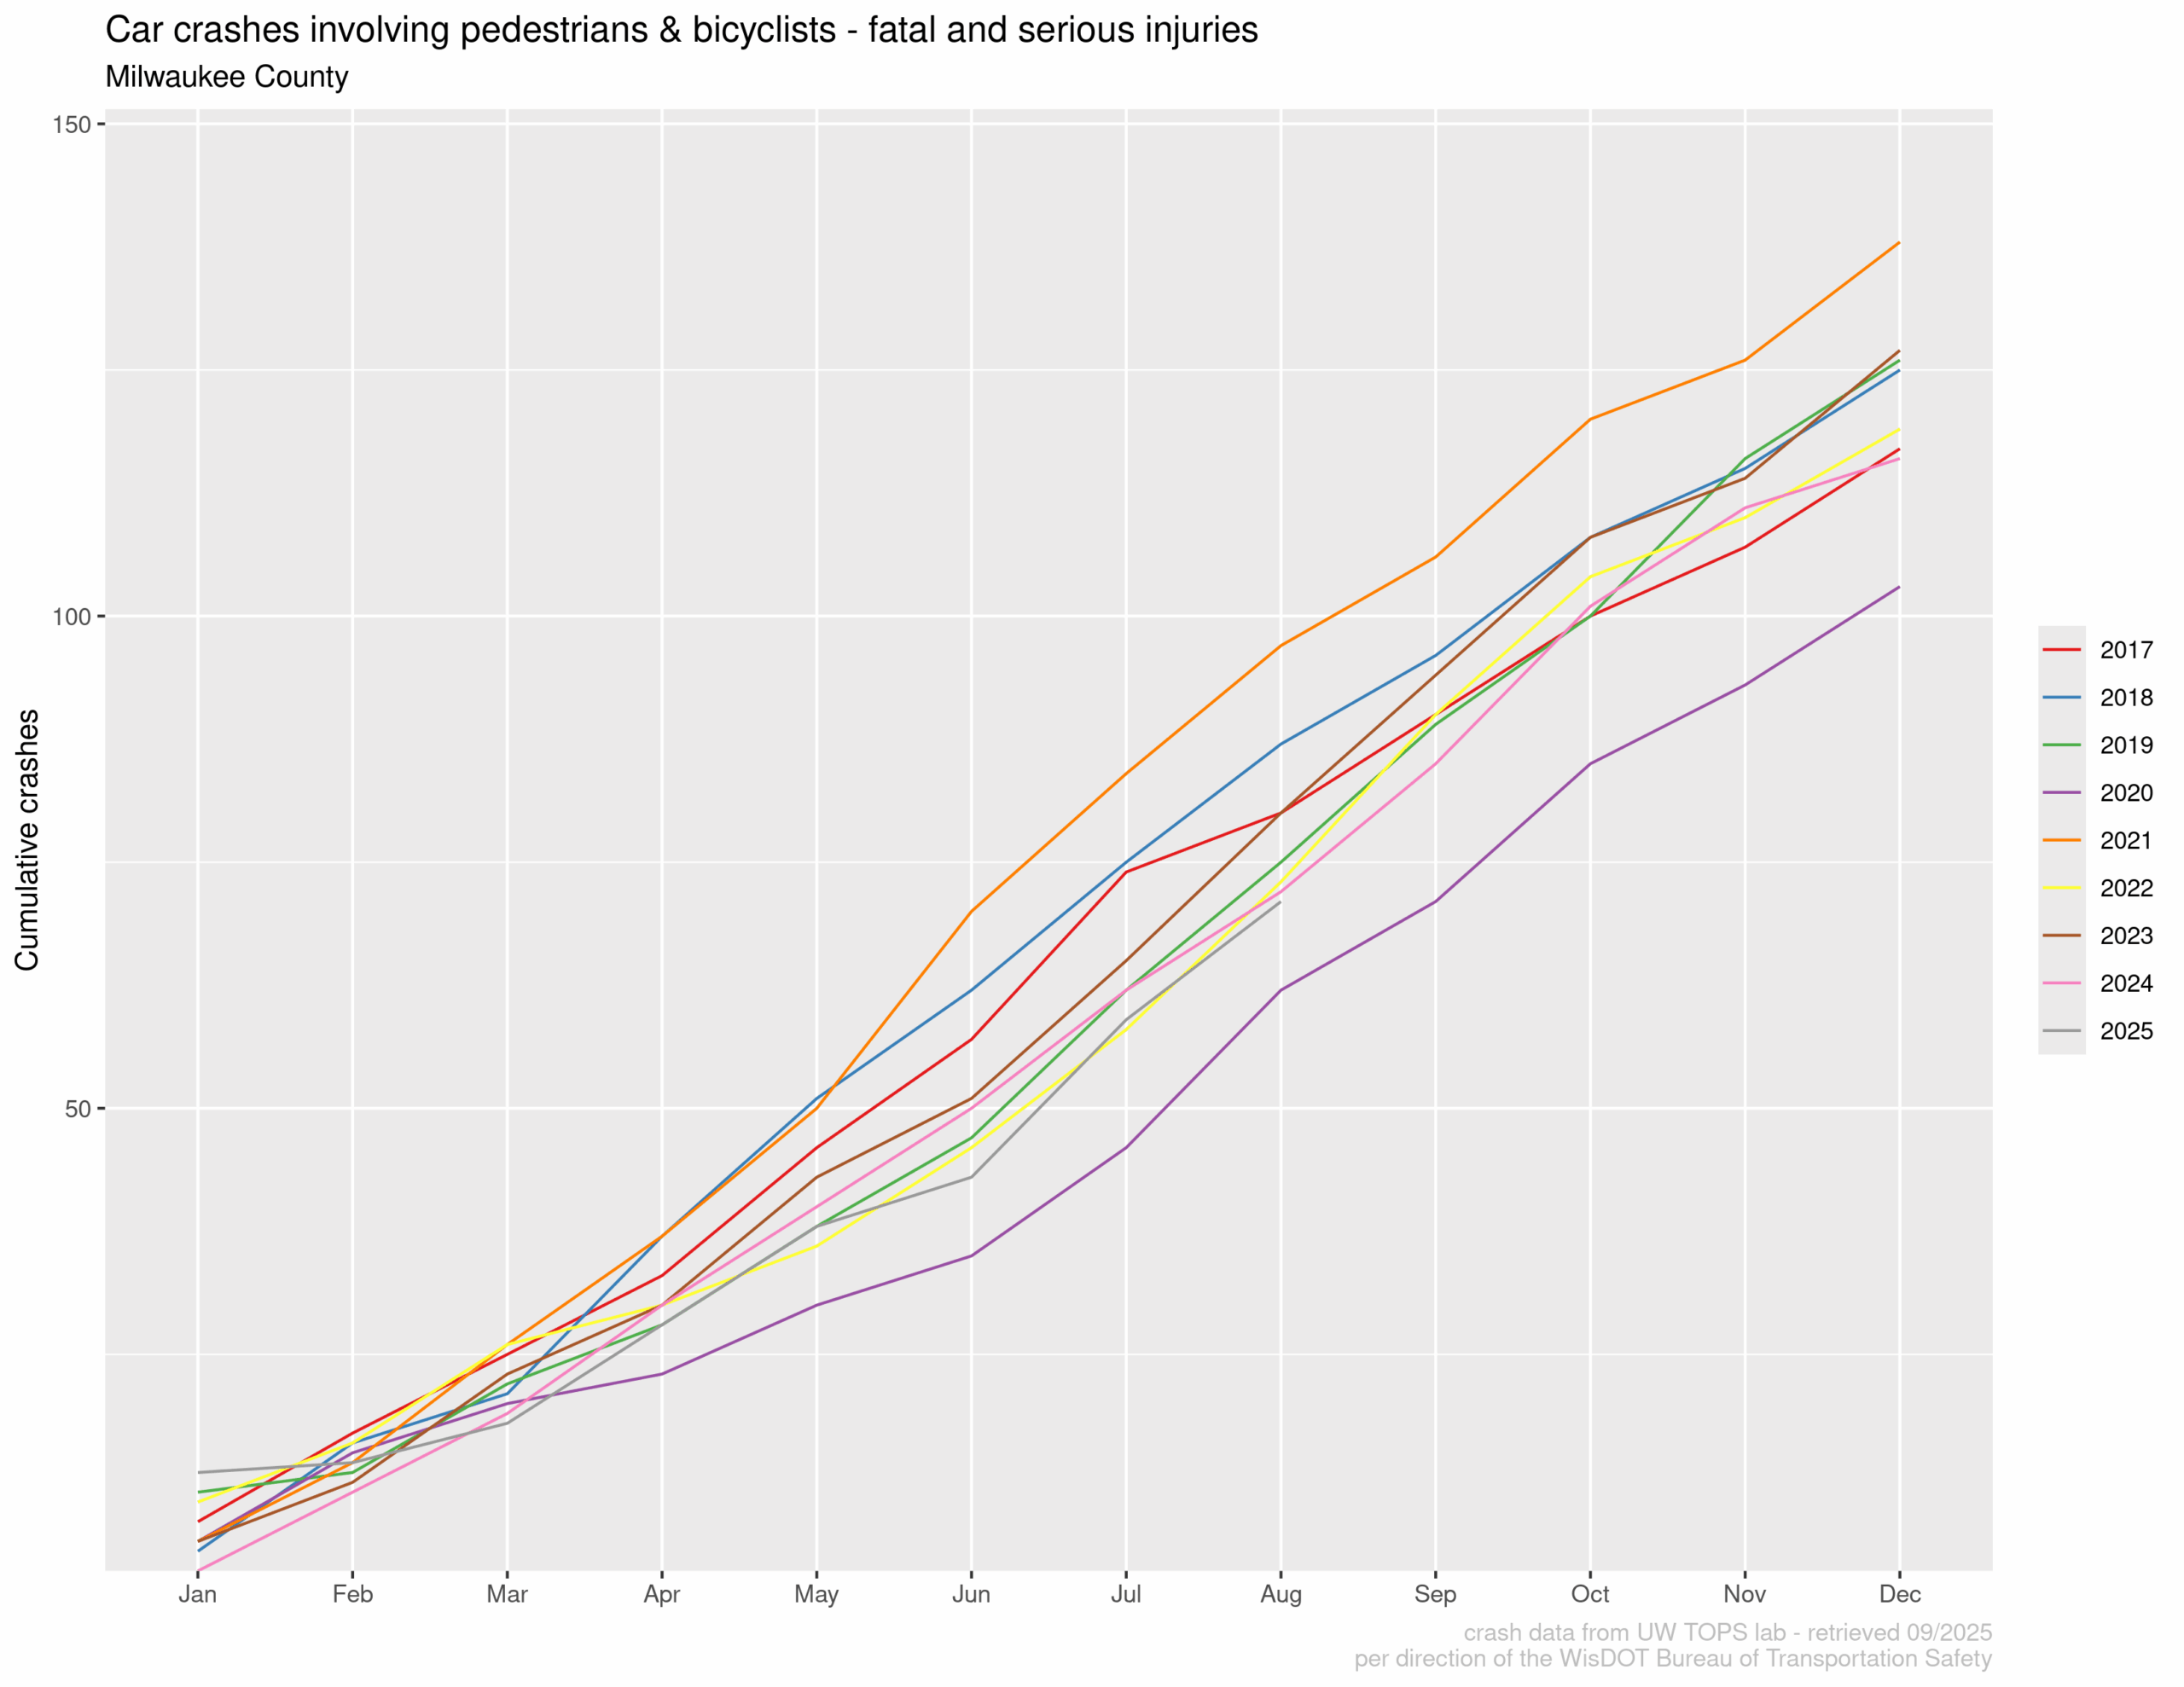
That’s a wonderful trend! However, 12 people killed in 2025 is still 12 too many.
How are crashes involving pedestrians different from crashes involving bicyclists?
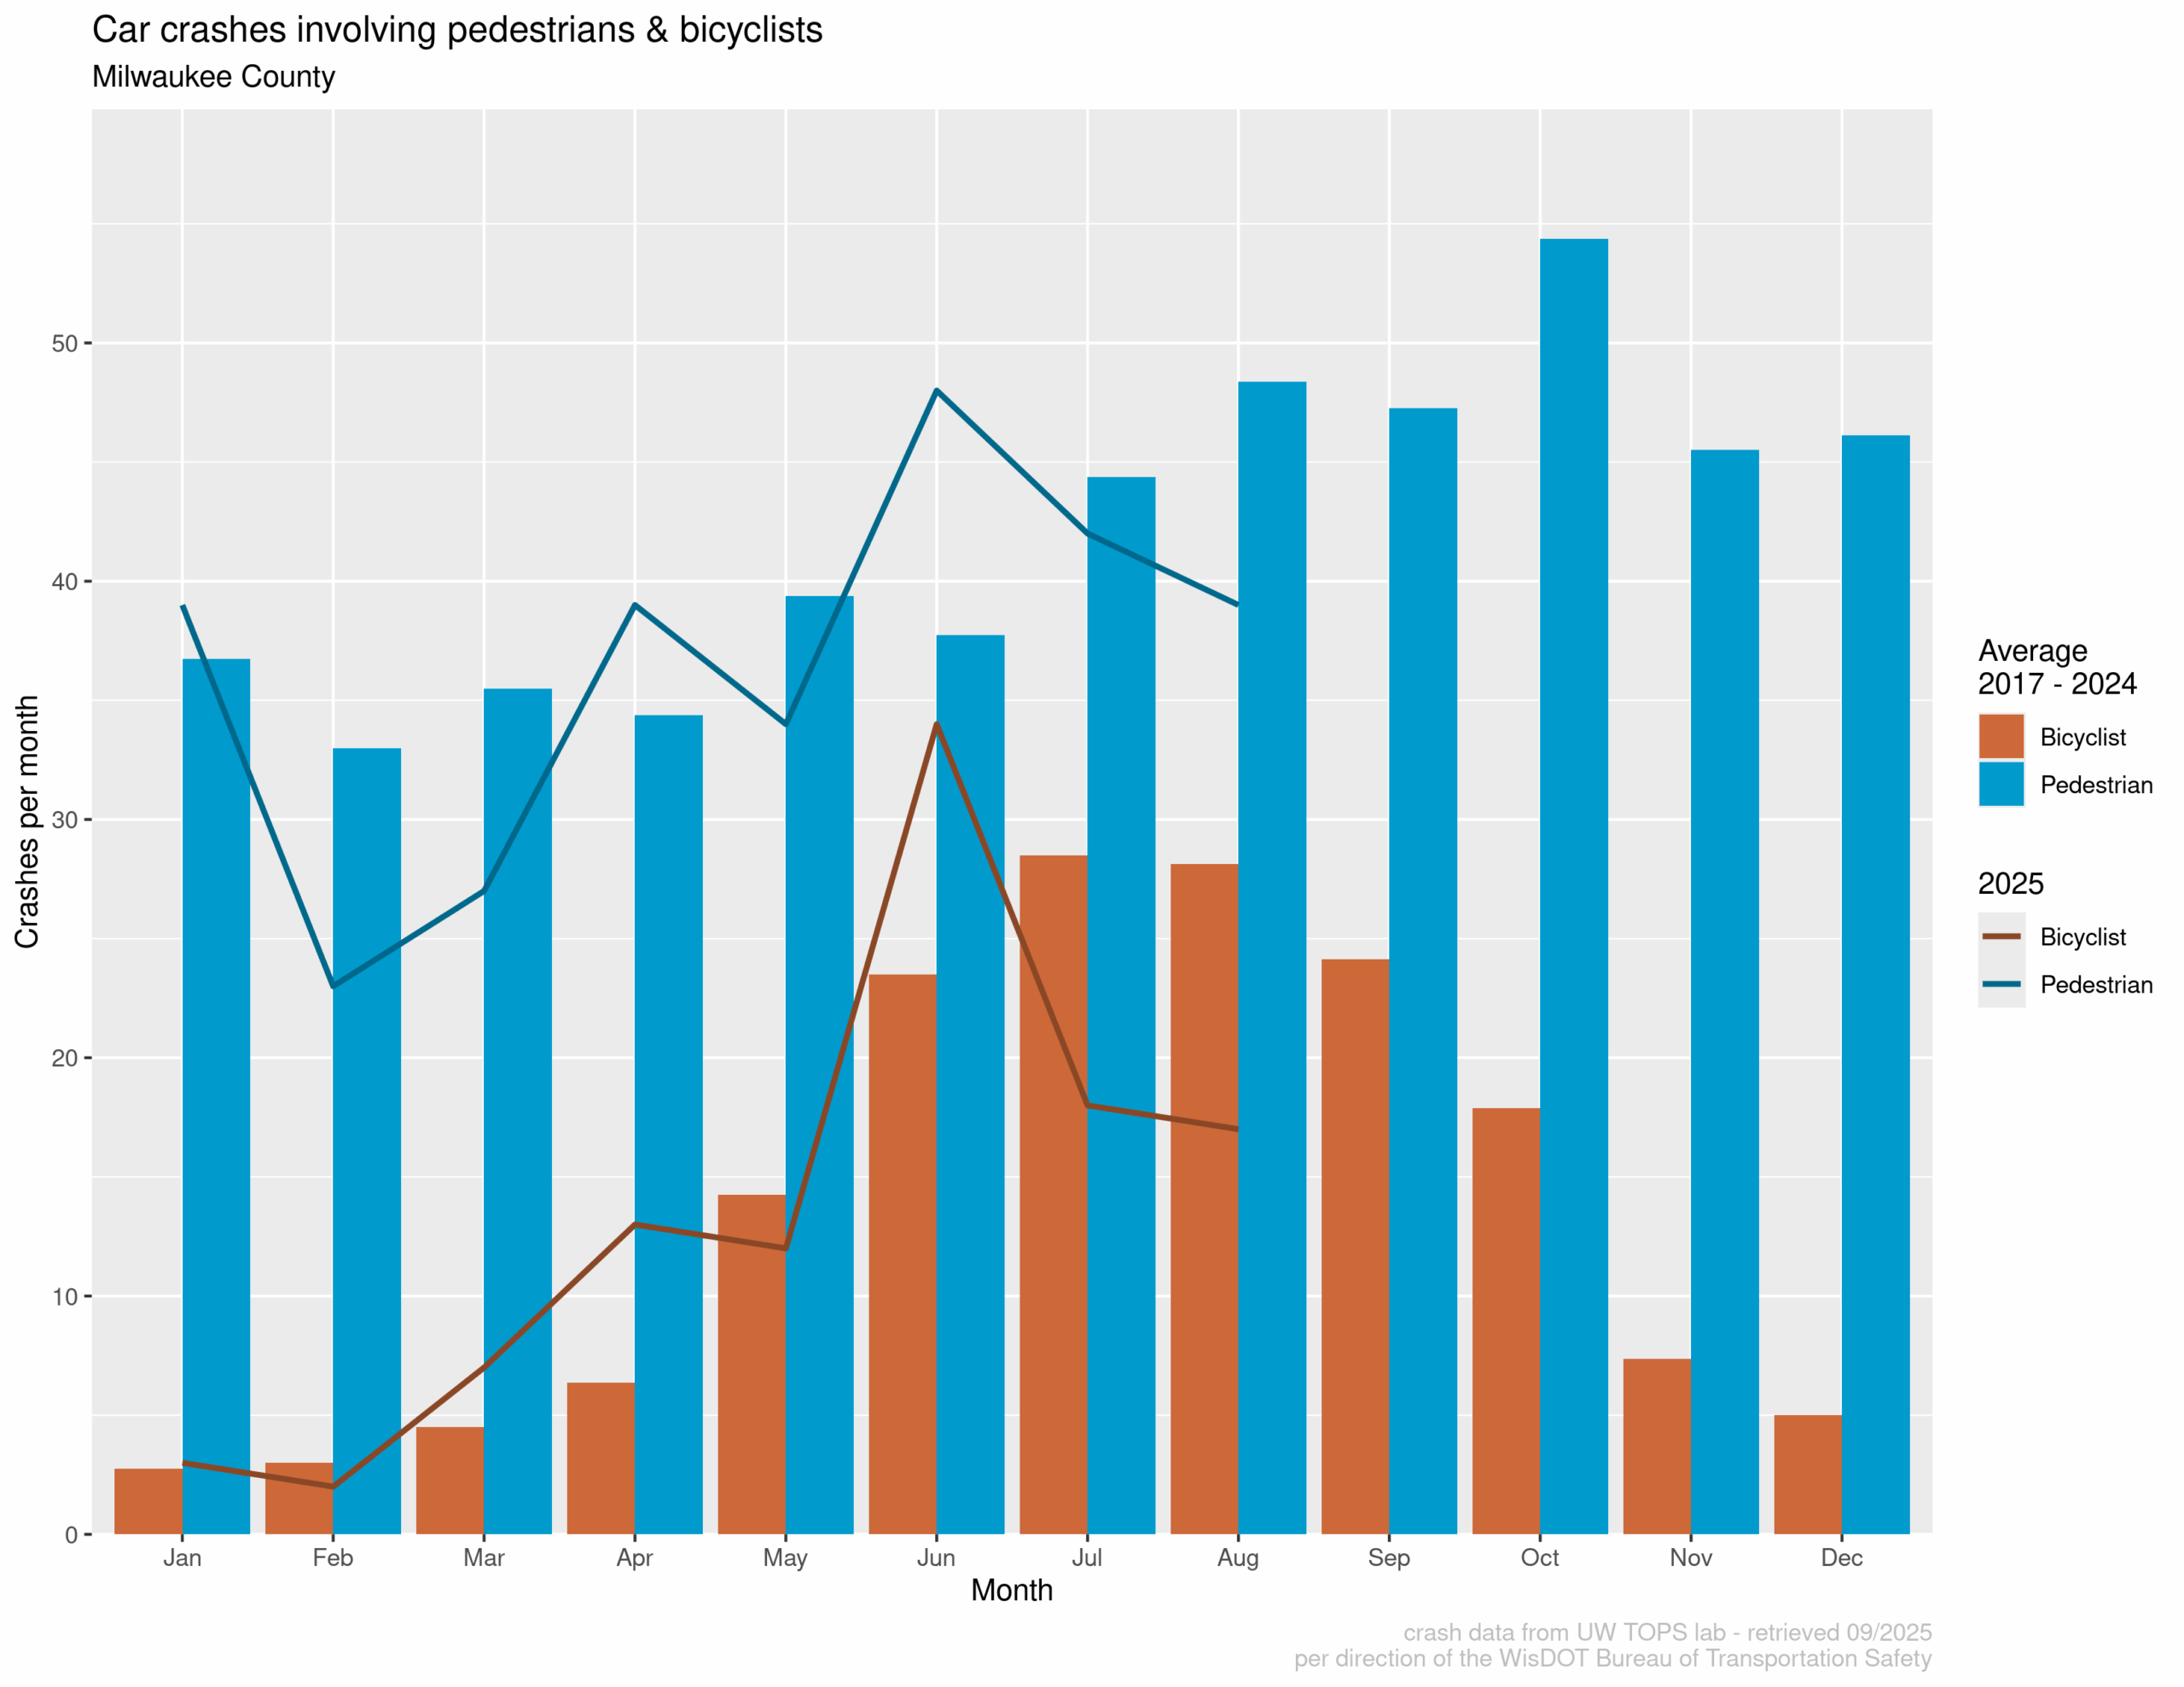
This graph is showing the monthly average number of crashes from 2017-2024 in the bars and showing the monthly crashes from 2025 on top of that with lines. The different colors are for car crashes that involved a pedestrian and car crashes that involved a bicyclist.
It’s interesting that there is so much more seasonality to bicyclists being hit than pedestrians. My hypothesis is that while biking swells in popularity in the summer, people walk year round. October has seen the most car crashes involving a pedestrian in the last several years, a great reason to focus on pedestrian safety this month!
2025 seems similar to past years, although there were fewer pedestrians being hit in February than average, and more bicyclists and pedestrians being hit in June than average. June was hotter than normal in Milwaukee, I wonder if that has something to do with the increase in crashes. We’ve seen fewer crashes in July and August this year compared with past years.
How many children and adults are being hit?
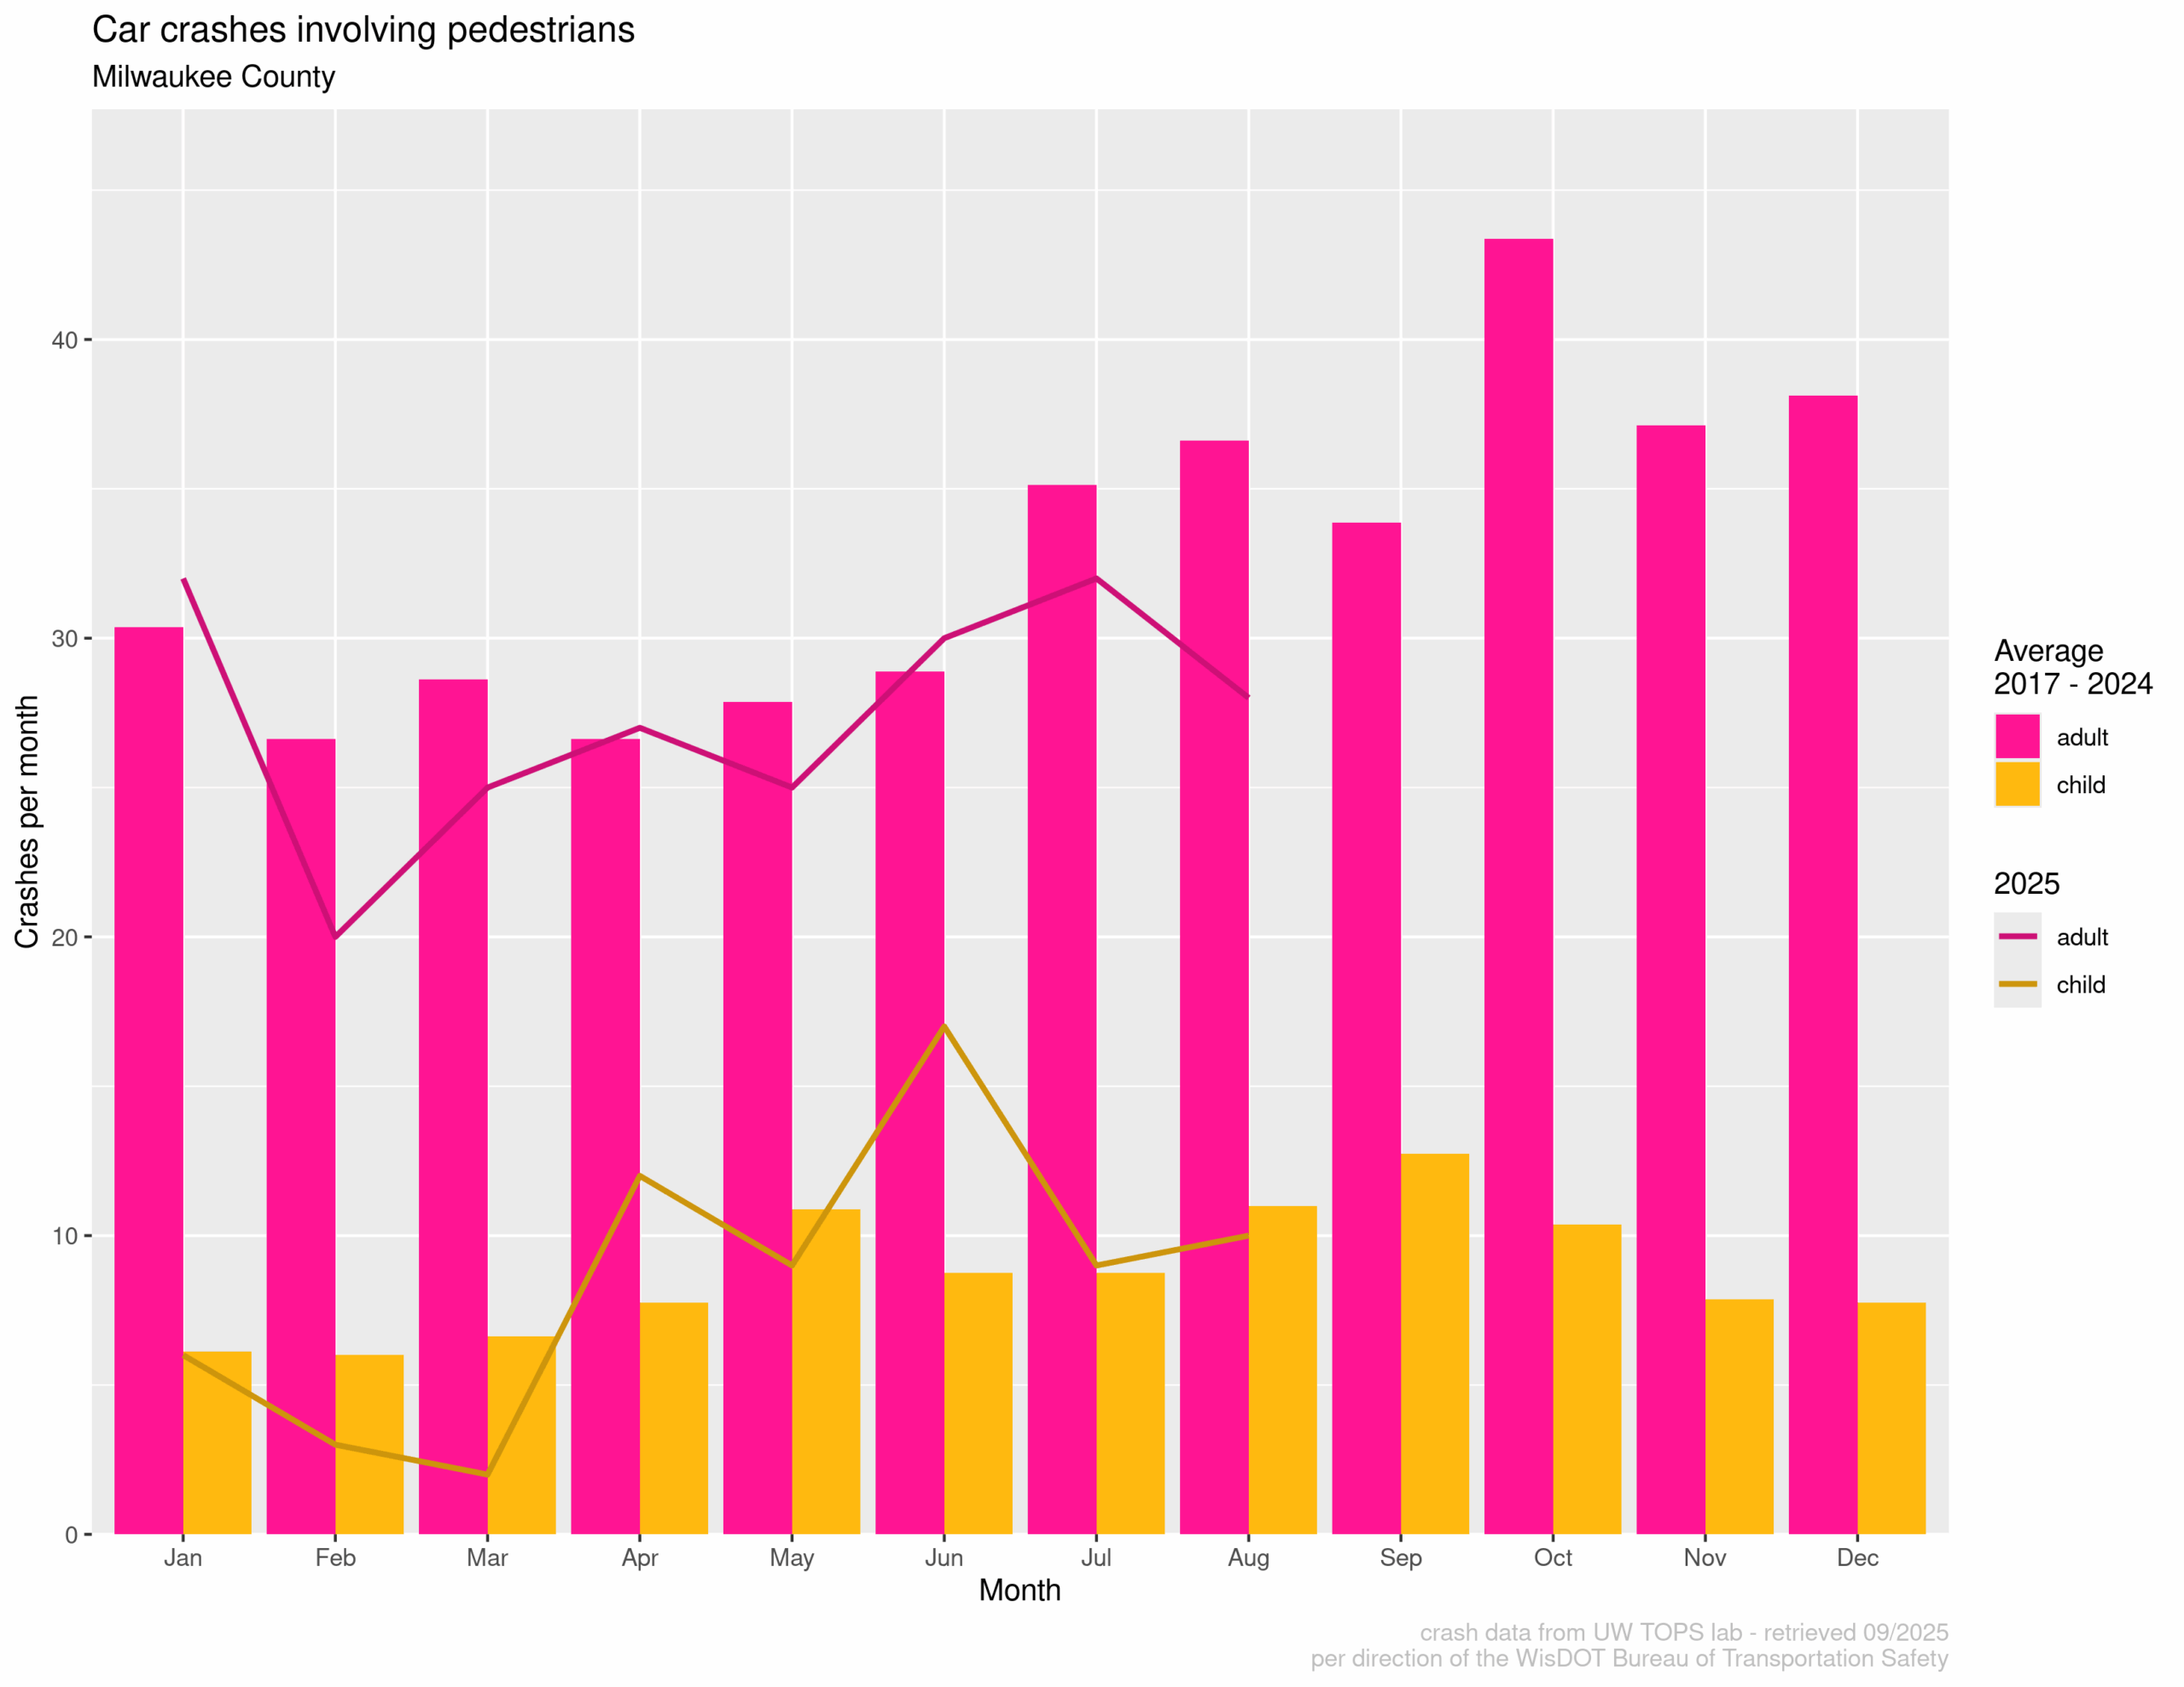
For children, the most crashes coincide with the warmer months of the school year (May, September, October). For adults, the end of summer into the fall/winter has the most crashes. October is a particularly big spike for adults.
So far in 2025, we see that kids were more likely to be hit in June, and adults less likely to be hit in July and August when compared with previous years.
Where are crashes happening?
Just looking at where the most crashes occur is often just a map of people live and walk. What would be more useful is a map of crashes relative to how many people walk there, but we don’t have good data on how many people walk on a specific intersection. So the next most useful thing to look at is change in crash patterns. So this map incorporates two things: how the crashes in an area have changed, and how many people have been hit in that area in the past.
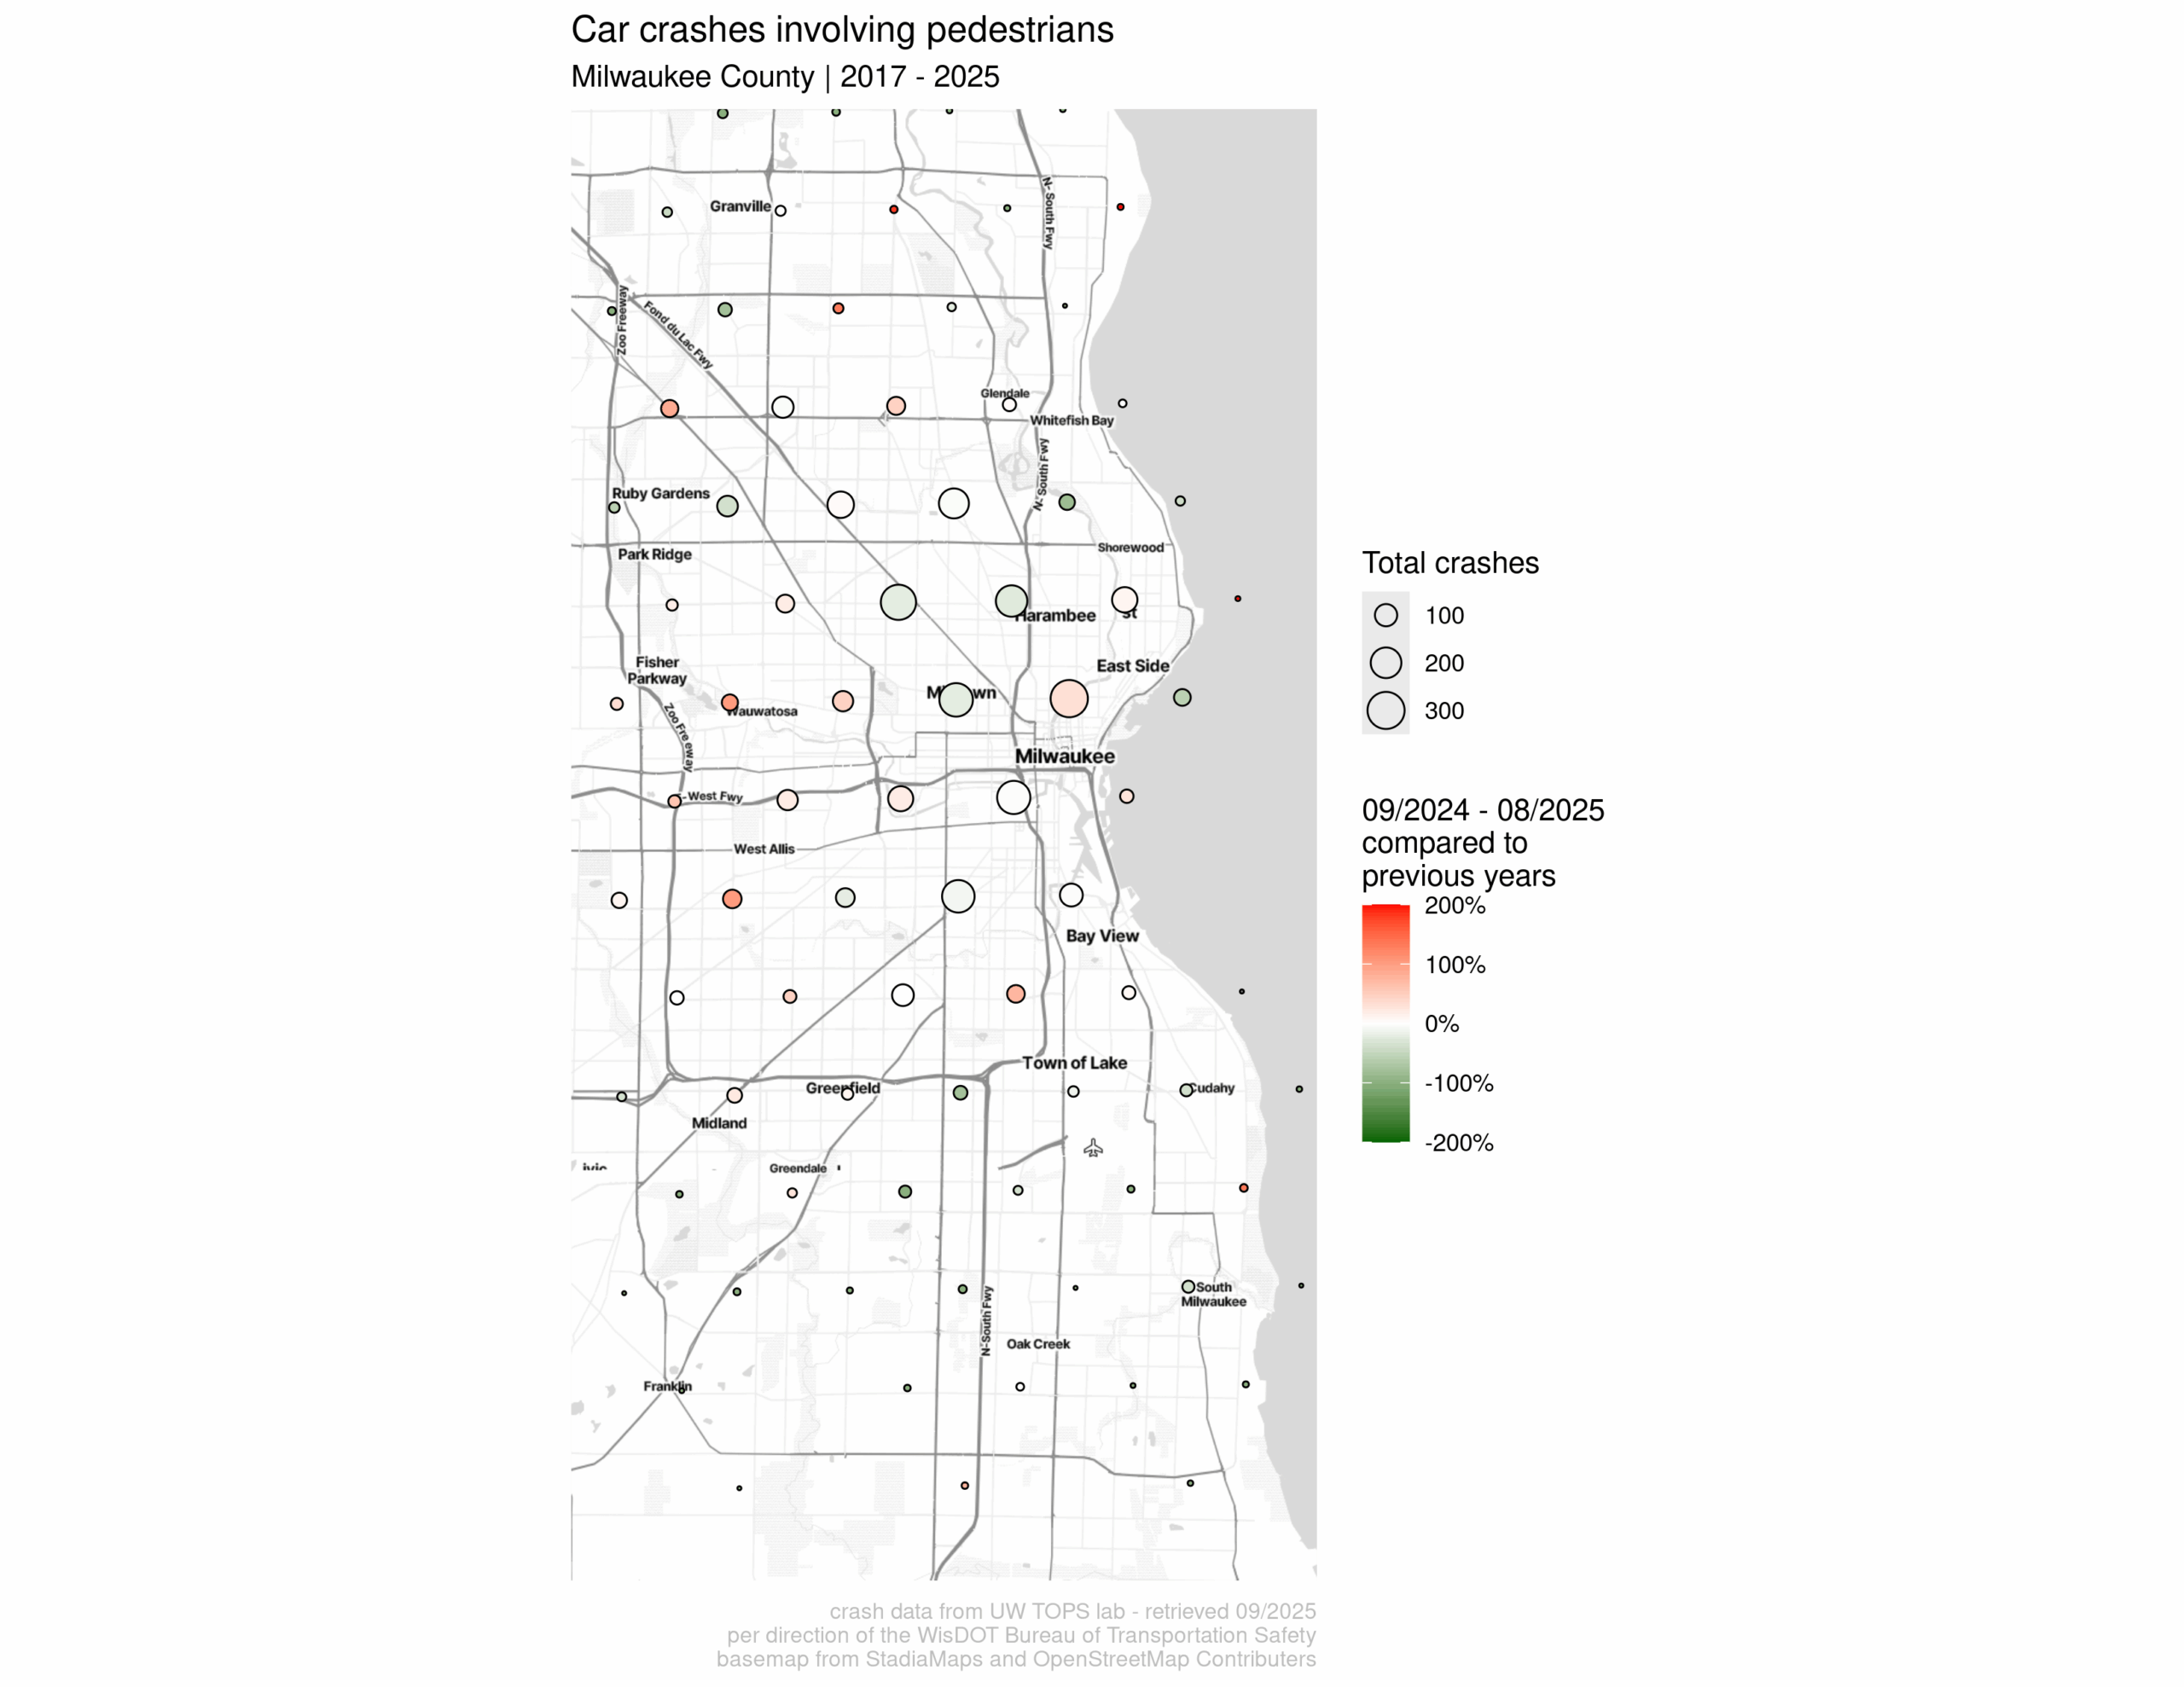
This map shows two variables:
- the size of the bubbles is how many pedestrians have been hit by cars since 2017
- the color of the bubble is how the last year of crashes (9/2024-8/2025) compares with the prior crash history of the area. The red bubbles are areas that have seen more crashes this year than previous, the green bubbles are areas that have seen less crashes this year than previous.
We’ll be looking at some of the specific parts of the city that have seen the biggest changes in subsequent blog posts.
What’s next?
In the next few blog posts, we’ll be diving into:
- How have pedestrian-involved crash patterns changed in different parts of the city?
- What the city is doing to improve pedestrian safety
- How are MilWALKee Walks programs improving pedestrian safety
- Fall specific patterns in crashes (daylight, Halloween, start of school)
How to learn more?
Learn more about MilWALKee Walks, the Bike Fed’s pedestrian Safety program here! Learn more about the work we do and get involved with some of our events.
Click here to read a summary of Milwaukee County’s 2024 pedestrian fatalities. You can also explore our interactive map, showing where pedestrians and bicyclists have been involved in motor vehicle crashes.
If you’re interested in how these maps and figures were created, you can see the code that generated them here.